Juniper Apstra Demo: Graph Explorer

Juniper Apstra’s Graph Explorer eliminates the need for manual graph queries.
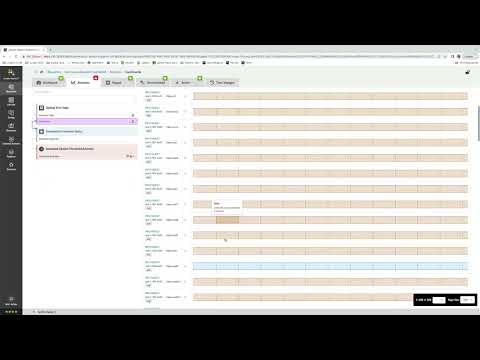
Good news: Manual graph queries are a thing of the past with Juniper Apstra® software—and no knowledge of graph language is required. With the new database query interface, writing a graph query is now as simple as clicking a button, adding value by creating new intent-based analytics probes and graph queries to use in your own code when developing automation against the Apstra API.
You’ll learn
How to build out a query based on the information you want to see using existing queries or simple modifications to suit your needs
How graph queries can aid in automation and in monitoring additional aspects of the data center fabric
Who is this for?
Experience More
Transcript
0:00 foreign
0:04 [Music]
0:08 the graph database can be considered the
0:10 backbone of juniper abstra's solution it
0:13 contains all of the information about
0:15 your data center Fabric and the
0:17 interrelationships between all of the
0:19 components within that fabric
0:21 starting with abstra 4.2 we have
0:24 released an even easier way to interact
0:26 with the graph database with our new
0:29 graph Explorer writing a graph query is
0:31 as easy as clicking a button without
0:34 needing to know a graph language
0:36 the value behind this comes into play
0:38 for numerous reasons but two keys are
0:41 that it adds value by creating new
0:43 intent-based analytics probes and
0:46 creating graph queries to use in your
0:48 own code when you are developing
0:49 automation against the abstra API
0:52 prior to this Edition you can manually
0:55 create a graph query but this was
0:57 something difficult for users you can
1:00 see an example here
1:03 now we have a graphical option that lets
1:06 you build out your own query based on
1:08 what information you want to see
1:16 we have some existing queries that you
1:19 can use out of the box or you can modify
1:21 to what suit your particular needs
1:26 these can form the basis for new probes
1:28 customized for your environment for
1:30 example let's take a look at this
1:32 predefined query this will show you all
1:35 of the ESI links within the fabric
1:38 you can build this out using the GUI and
1:41 then you can edit it either textually or
1:44 within the GUI and execute it
1:47 since I clicked the play button
1:48 previously it's already been executed
1:51 for us
1:52 we can see the results of our graph
1:54 query all of the ESI links within the
1:57 fabric as well as any Associated
1:58 information
2:00 this is a very powerful tool for
2:02 analytics and development and helps
2:04 operators quickly and efficiently create
2:07 graph queries to Aid in automation or
2:09 monitoring additional aspects of their
2:11 fabric thank you for watching this demo
2:14 [Music]
2:17 thank you


