Juniper Mist Wired Assurance and Campus Fabrics


Here’s how to deliver better network experiences for campus users.
In this video from Tech Field Day 2023, Juniper’s Abhi Shamsundar shares how Juniper’s AI-Driven Campus Fabric transforms network operations from Day 0 through Day 2+. You’ll learn how Wired Assurance and automation can vastly improve the experience for users and connected devices on any campus.
You’ll learn
What exactly is an AI-Driven Campus Fabric?
How Juniper’s AI-Driven Campus Fabric makes it easy to troubleshoot — and resolve — network connectivity issues
Who is this for?
Host

Transcript
0:08 uh my name is abhisham Sundar I'm a part
0:11 of the product management team uh my
0:13 focus on wired assurance
0:15 I'll brief you on a quick reiteration on
0:18 what wired Assurance as a portfolio is
0:20 as well as what we're planning to do
0:22 today
0:24 our Focus currently uh from a missed
0:28 standpoint of it as is encompassing
0:30 every piece of the uh Network every
0:32 Network equipment all the way from
0:34 Wireless wired and Van and ultimately
0:37 give you answers on What the experience
0:39 is like a Christian spoke about you know
0:41 your ex your Zoom calls breaking up
0:43 where could be the problem we have the
0:46 Telemetry coming in from Wi-Fi we have
0:48 Telemetry coming in from wired as well
0:50 as the van portfolio our focus is on how
0:54 do we get the most out of this Telemetry
0:56 and make the most sense out of Fitness
0:58 answer tough questions as to why the
1:01 there was a problem or an experience
1:03 with your uh
1:04 uh with your application and answer that
1:08 as to where the problem is so uh we'll
1:11 focus on campus fabric today uh before
1:13 campus fabric
1:15 wired Assurance is the piece of uh what
1:18 Christian said we're mystifying stuff uh
1:20 we're talk we're talking about how are
1:22 we able to onboard devices faster how
1:24 are we able to get uh easy uh a way of
1:28 deploying and deploying at scale and
1:30 also the last part of it is how do we
1:32 operate so day0 day one and day two as
1:36 we as we classify them uh Day Zero where
1:38 how are you able to onboard devices we
1:40 we brought every single aspect of how we
1:42 onboarded missed APS to the world of
1:45 switching as well every single switch
1:47 that goes out is shipped out with the
1:49 claim code uh you can actually either
1:51 onboard all of your devices that are
1:53 part of a particular purchase order in
1:56 one shot or you could do them Via mobile
1:58 app as you go installing them racking
2:00 them and stacking them so the goal for
2:03 us is to make this uh make the
2:05 deployment ask console free a console
2:06 cable free as possible uh you you uh you
2:10 take a snapshot from your mobile app
2:12 you're able to claim the device onboard
2:15 the that you would have already
2:16 configured them at scale and the device
2:18 would be able to automatically connect
2:20 the cloud get its config and start
2:23 serving its clients be it APS beat
2:25 switches uh be subsequent switches from
2:27 there on that's the day Zero part of it
2:29 the deployment piece there's a host of
2:31 things that that we have again brought
2:33 automation into if we can identify the
2:36 nature of the device we can give it the
2:37 config if it's a camera if we identify
2:39 the device as a camera you could tell us
2:41 what the camera config looks like we
2:43 call that Dynamic Port configuration and
2:45 that's that's enabled into the internet
2:47 Network
2:49 uh and deployment at scale we'll talk
2:52 about deploying an entire campus uh
2:54 we've heard from the delegate panel
2:56 before uh it's great to see videos but
2:59 you would rather see them in action
3:00 today we're going to deploy an entire
3:02 campus Network right here in front of
3:05 you and we're gonna have a surprise at
3:07 the end of it as well as to how we can
3:08 make that you know make the learning
3:10 part of it simple as well
3:12 uh day two uh it's it's our whole Focus
3:16 uh when we moved into the world of uh
3:20 learning wired was to say how can we
3:22 make day two operations simpler we spoke
3:24 about you know the slis we we brought
3:27 the construct of sles from the Wireless
3:29 World sle's answered the question SLS as
3:32 we call them a service level
3:33 expectations answer the question how is
3:35 your network doing from a client
3:37 experience perspective and not just you
3:39 know the devices being up or down the
3:43 network devices being upload on so we'll
3:45 talk about Marvis actions today Marvis
3:47 actions uh is is your cup of coffee View
3:50 and also alerting
3:52 our goal for something from the cloud to
3:55 administer this is to make an
3:57 administrator's life easy uh in terms of
4:00 automation uh we will sprinkle AI to
4:03 make that happen but our goal is is
4:05 eventually to make the life of that
4:07 network administrator simpler
4:10 so uh we're going to talk about the AI
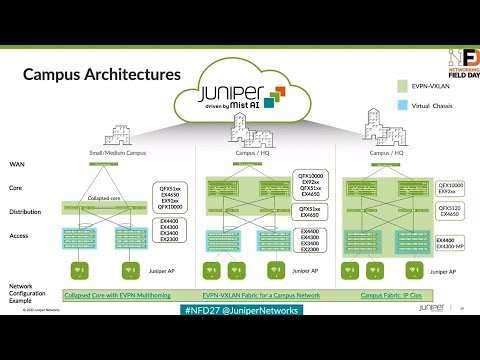
4:13 driven campus fabric today uh so what is
4:16 AI driven campus fabric campus fabric is
4:18 the technology that we've ran uh uh I
4:21 mean it uses EVP and vxlan underneath
4:24 for us to enable uh all of the new
4:27 challenges that that come alongside from
4:29 a perspective of running campuses at
4:31 scale uh so we use evpn in vxlan to make
4:35 those possible Rick will talk in great
4:36 detail you sprinkle missed AI on top of
4:39 it utilizing missed AI to deploy faster
4:42 understand problems faster that gives
4:44 you uh AI driven campus fabric
4:47 I'll quickly run through a two-minute
4:49 demo of wired Assurance as a whole and
4:52 then subsequently Rick will walk us
4:54 through campus Fabric in detail what
4:57 what it means how using the technology
4:58 what are the problems it solves and
5:01 we'll run a demo of building an entire
5:03 campus right here
5:08 so uh from a construct of
5:12 us saying how are we able to solve the
5:15 problems uh we'll we'll showcase all the
5:17 entire building of of the network in
5:19 front of you so the day Zero and day one
5:21 will we will technically Showcase in the
5:22 upcoming demo let's talk about day two a
5:25 little bit we said we are able to answer
5:27 the question of how is your network
5:29 doing and this is the wireless SLE
5:31 framework we started off with this
5:34 always starts with two questions is your
5:36 client able to connect okay which we
5:38 call as you know the pre-connection and
5:40 is is your client able to pass traffic
5:42 okay if there are any experience issues
5:44 during this process
5:45 the same constructs were brought into
5:47 the world of wire networking as well
5:49 wired networking as most most times it
5:52 may seem uh simple and may not
5:55 necessarily seem as complex as Wireless
5:57 but there are a host of problems that we
5:59 can bring about the answer for always
6:01 for us to say you know there are issues
6:04 with your switch Health we'll talk about
6:05 a little bit but are they able to
6:07 connect okay if they're not what could
6:10 be the reasons a client coming in is it
6:12 able to authorize and authenticate okay
6:14 is it able to get its DHCP okay and pass
6:17 traffic if it starts going through the
6:19 process of passing traffic is it is the
6:22 experience of traffic passing traffic
6:24 okay so hitting congestion on the
6:26 network uh are you is it being storm
6:29 control my favorite one though uh we
6:32 talk about anomalies on the interface
6:34 segment itself or we we go all the way
6:37 from layer One issues uh and MTU issues
6:40 from Layer Two and also negotiation
6:42 failures if there are congestion in the
6:44 network
6:45 all of these pieces are all brought to
6:47 you and said you may have 3 000 ports in
6:51 your network this Juniper Network's uh
6:53 organization actually is an organization
6:56 of close to 300 switches in all now
6:58 among amongst this particular site by
7:01 itself amongst the 300 searches if each
7:03 of them is also 50 ports we're still
7:05 talking 15 to 20 000 ports here
7:08 amongst your 15 to 20 000 ports how many
7:11 of your ports
7:12 are actually seeing an issue is what the
7:16 end goal for um
7:19 um the wire Assurance portfolio is
7:20 bringing your ability to to say this is
7:24 running at scale we are telling you
7:26 exactly
7:28 the internet we're telling you exactly
7:30 the devices that are affected and
7:33 telling you that these are the places
7:34 where you would want to look at okay
7:36 sorry David and also here yeah I
7:38 couldn't avoid but look at the
7:40 throughput section so in which way we
7:42 measuring throughput there is an agent
7:44 sitting in then into the box on this is
7:46 running it in both directions inside of
7:48 proverb how do you know that there's
7:51 actually a good throughput because it
7:53 might be also derivated from derives are
7:56 from several things there's a thick wall
7:57 in front of it or maybe there is
8:00 something else is a to do that what 11
8:03 and ABG and I see whatever there could
8:05 be many reasons but how then are you
8:08 able to see that the actual Troop that
8:09 you're measuring it is correct what's
8:11 the method uh we'll focus on the the why
8:15 this Wireless section to it as well like
8:17 you mentioned abgn the capacity of the
8:19 device uh where we actually say that the
8:21 device capacity is what is limiting it
8:23 that comes from the wireless side of the
8:24 house from the wired side of the house
8:27 we have the device constantly talking to
8:30 the cloud the device is having a
8:33 heartbeat to the cloud so we don't have
8:34 to actually have an agent rather the
8:37 Baseline the actual latency Jitter
8:40 Matrix for us to look and loss metrics
8:42 for us to look at it so now you're
8:44 looking at the connectivity of any
8:45 Northbound traffic is a representation
8:47 of what's happening on it so we don't
8:49 run agents on on the on the device for
8:52 us to say are we talking to AWS okay but
8:54 it's more about we have uh we have our
8:57 Cloud we have our own switches we are
9:00 always constantly talking we have a
9:01 heartbeat we Baseline uh what's your
9:04 latency geometrics like and we are able
9:06 to uh actually extrapolate from the fact
9:09 that that's cool so these sorry again so
9:12 these throughputs that you're showing
9:13 here is box wise as in backplane
9:16 capacity or are we going into the
9:19 specific Port Bay Port by Port then
9:22 stats and then okay so import one you're
9:24 getting 100 but maybe in Portugues and
9:25 getting a jig yeah I was gonna pick to
9:28 piggyback off David's like question like
9:30 how deep excuse me how deep can you go
9:32 with this you know like can you click on
9:34 the device not only did you see the
9:35 thorough put but okay well here's the
9:36 health of it here's the time like if you
9:38 needed to generate some kind of report
9:39 yeah for yourself or your team and then
9:41 maybe export that into something you
9:42 know and kind of monitor device health
9:44 and things of that nature so uh to uh
9:46 for the two questions how deep can we go
9:48 uh we start with uh saying this is the
9:50 distribution subsequently you can go
9:52 into the exact interface uh and then you
9:56 can say you can also distribute it based
9:58 on vlans if there are multiple vlans in
10:00 the network in fact we can go to go
10:01 based off a client as well because we
10:03 know the client Mac address of the
10:04 device that's connected then the tripod
10:07 at the top is box wise in this case it's
10:09 Global correct it's a global on a per
10:10 box excellent okay
10:13 um and then subsequently if you if you
10:15 know you know amongst so what we are
10:17 showing here in the interfaces section
10:19 uh in all honesty is amongst your
10:22 um you know 15 000 ports that across 300
10:25 switches we're giving you you those 20
10:28 or 15 whatever the number of interfaces
10:30 there are that are in this state so you
10:32 are not going and looking at uh
10:34 Telemetry or instance from every single
10:37 interface we're doing that for you but
10:39 we're telling you uh as an admin your
10:41 focus should be here uh and also the
10:43 same case we were telling about we
10:45 classify on failure rate so that you can
10:47 actually focus on the right elements
10:49 okay then in case that because I
10:51 understand that this is already filtered
10:53 out and then you get just the more
10:54 relevant things but if I would want them
10:56 to go into details for whatever the
10:59 reason doesn't matter then I can also do
11:01 it so it doesn't have just the
11:02 simplified thing in which you you're the
11:05 one deciding what I should be looking at
11:07 right yeah we'll tell you uh globally so
11:09 that it's easy for you because we're
11:12 talking scale here uh you can actually
11:14 say if you don't if you're not not only
11:16 just this particular sign you want the
11:19 health of your entire organization in
11:20 one shot uh you want to filter this by
11:23 the verse 100 sites we have customers
11:26 who have three thousand four thousand
11:28 sites on on the network how do they
11:30 focus on on the right ones but to answer
11:33 your question if you want to focus on
11:35 and say I want to know about this
11:37 particular Port you can always think the
11:40 exactly to the port of choice I love
11:42 that the filtering because it's the
11:44 worst 100s because nobody monitoring
11:46 wants to see the cute one yeah that's
11:48 right so that's the goal uh so that's
11:51 that's wire Assurance in a quick
11:53 nutshell uh
11:55 Rita younger is um their way to
11:58 customize this dashboard so you're
12:00 looking at a view that has maybe
12:01 throughput some other metrics on the
12:04 same window
12:05 uh if I go into the monitor screen uh
12:10 the SLE screen you can actually say uh I
12:13 mean obviously you can say which ones
12:15 you want to look at uh in here and the
12:17 same can be done at an entire org level
12:19 as well to say I don't care about switch
12:21 Health show me just the throughput
12:23 pieces of it I don't care about or you
12:26 would rather say I want to focus on the
12:27 successful connect because I want to
12:28 make sure the clients are connecting so
12:30 there is customization to a point where
12:33 you can you would you can say these are
12:35 the areas I want to focus on I'm not
12:37 sure if if that that's what you were
12:39 looking for yeah I guess I'm looking for
12:41 you know the mythological single pane of
12:43 glass single pane of glass uh so there
12:45 is report two parts to it one is active
12:49 troubleshooting where you're looking at
12:50 this and then there is the analytics
12:52 where we talk about criminal analytics
12:54 soolini will go into great detail about
12:56 how do you want to see what what was the
12:58 nature of the network 60 days ago or
13:01 nine nine months ago and then you can
13:03 compare and contrast I did this
13:05 implementation is my life better so uh
13:07 you can look at live troubleshooting
13:09 from here on going to exactly the
13:10 interface of choice or the port of
13:12 choice and then subsequently you can
13:14 also look at analytics pieces of it as
13:16 well so those are those are two pieces
13:18 available


